There are only two ways to get more policing out of the people you have: put them in the right places, and have them working at the right hours. PatrolDesk measures both — from the data you already publish.
NO INTEGRATION TO START · RUNS ON PUBLISHED OPEN DATA · NOTHING TOUCHES YOUR SYSTEMS
“Data said from 3 a.m. to 7 a.m. we had 8% of our call volume, yet we had 33% of our personnel working.” A POLICE CHIEF, JUSTIFYING A BUREAU-WIDE SHIFT CHANGE. COMPUTED ONCE, BY HAND. NOBODY CHECKED IT AGAIN.
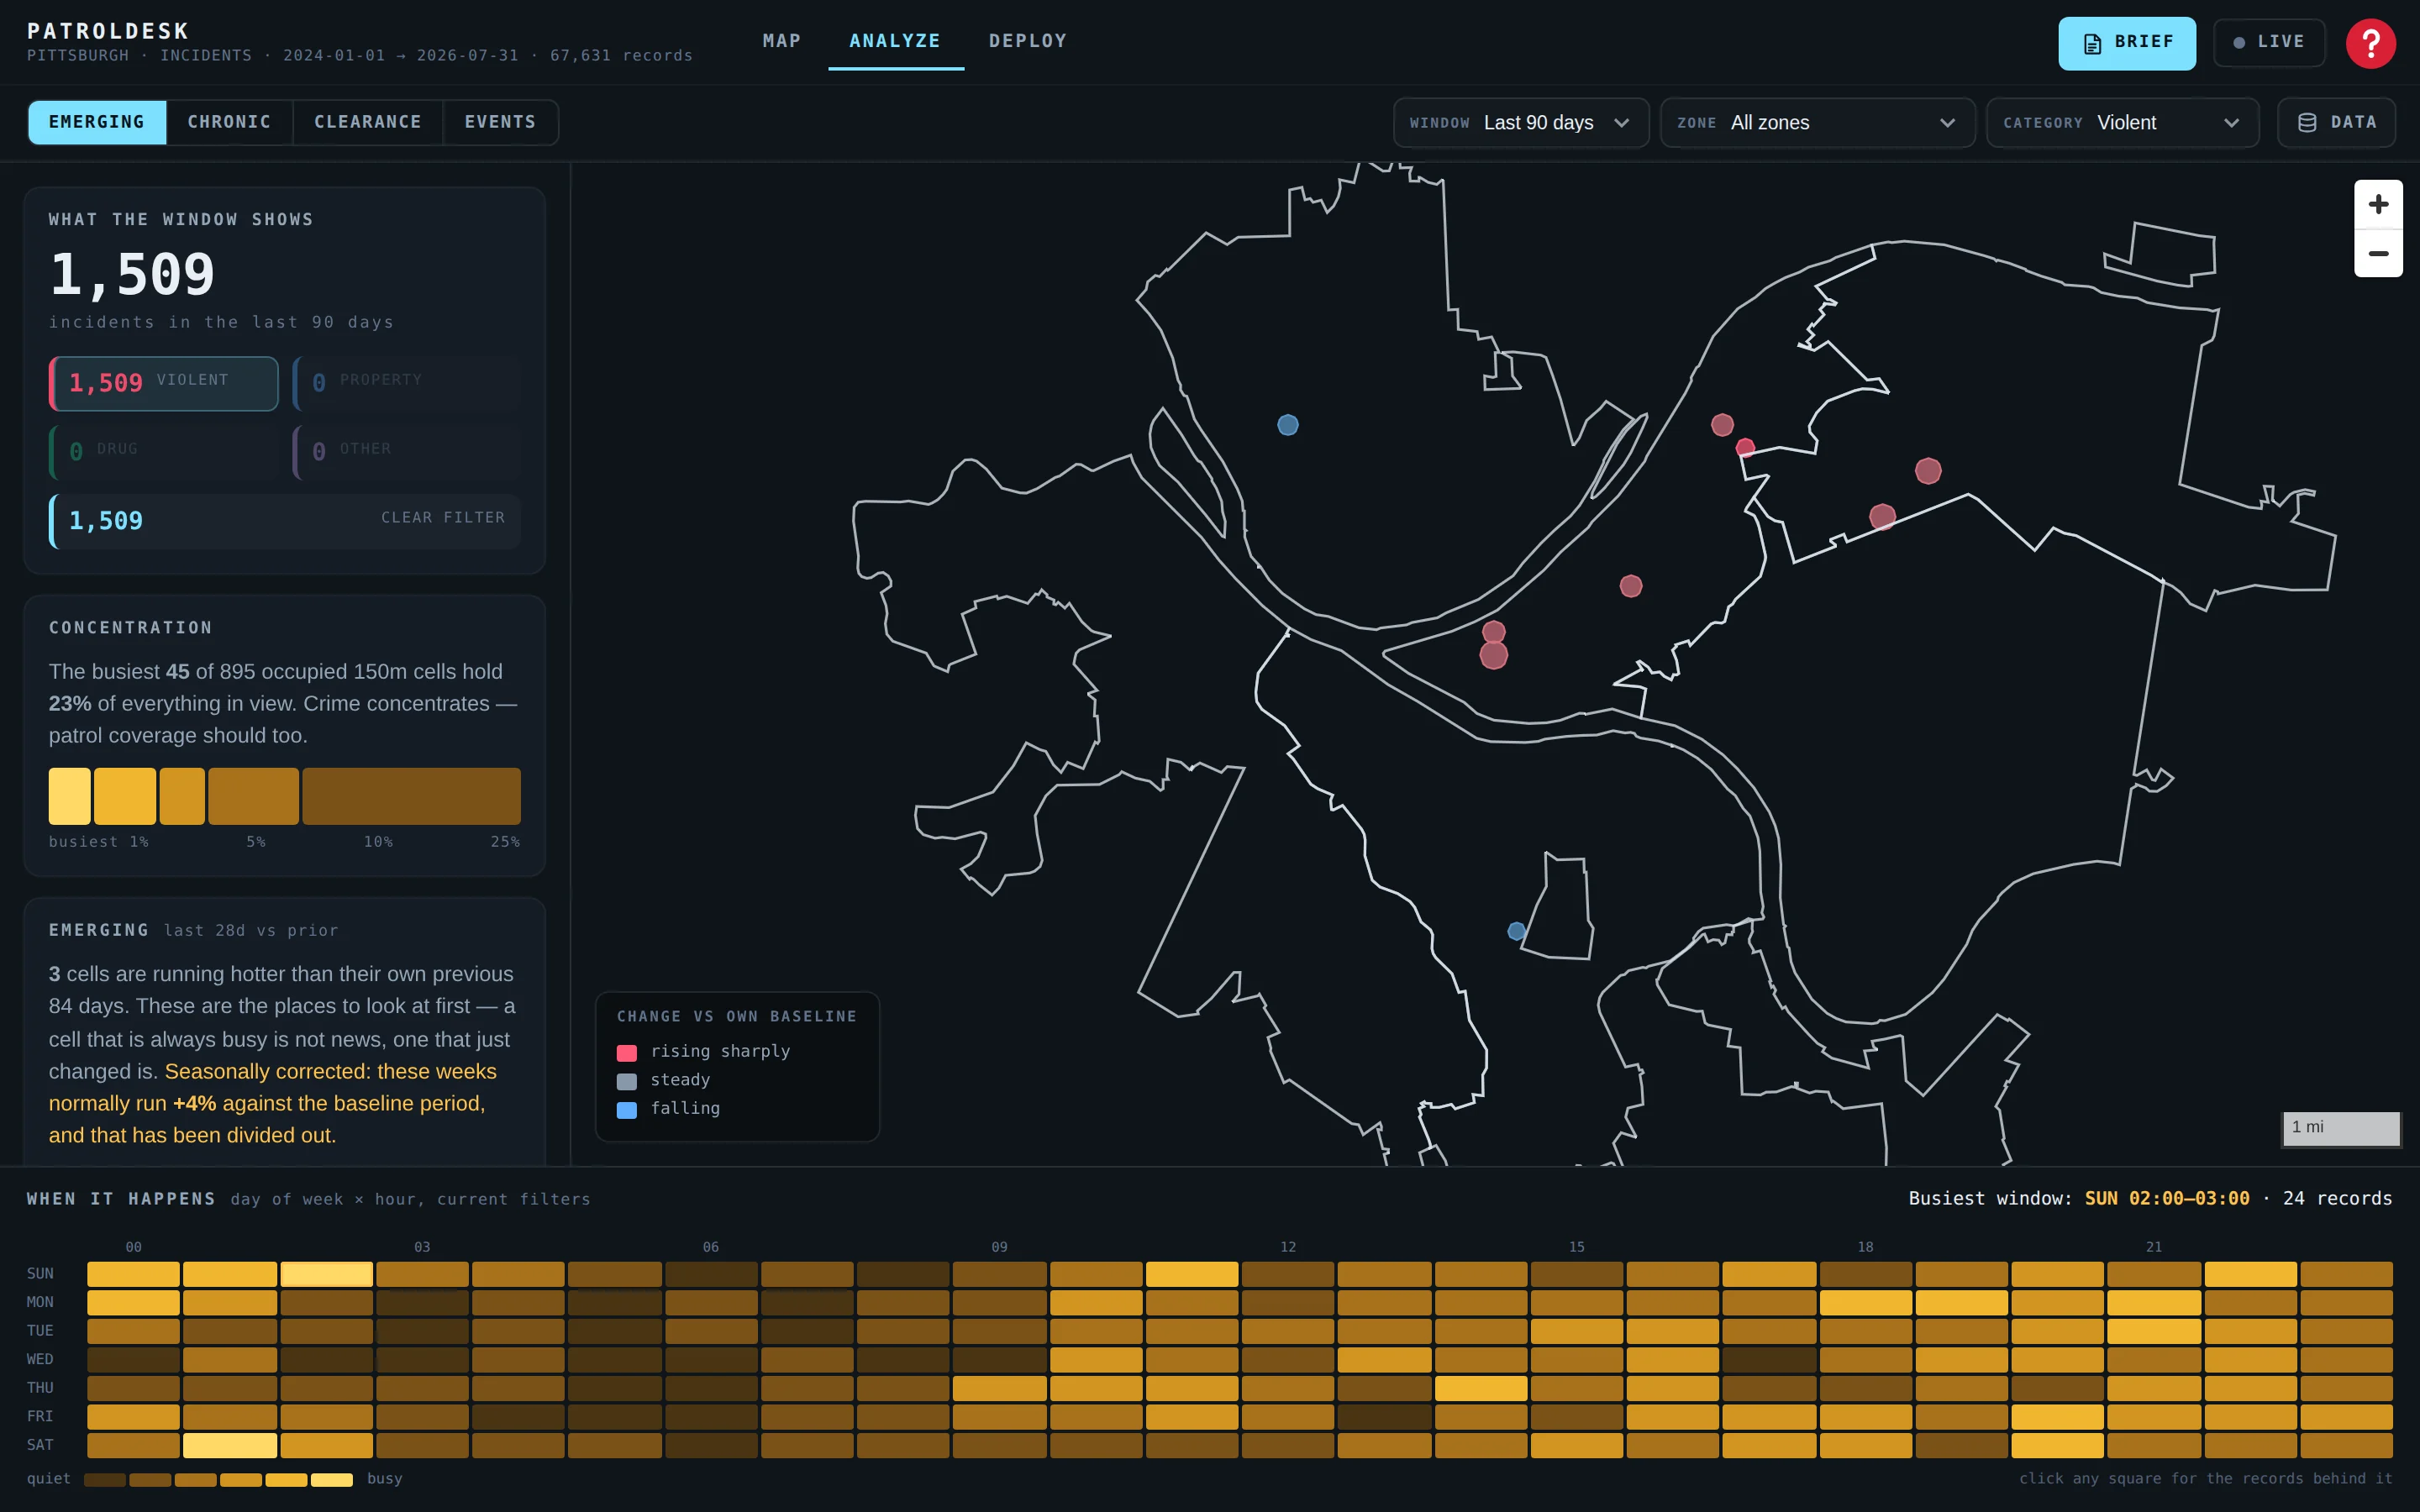
Five percent of the places hold a third of the crime. PatrolDesk finds the places that changed — scored against their own history, not a city average — and turns them into a watch order a sergeant can read at roll call.
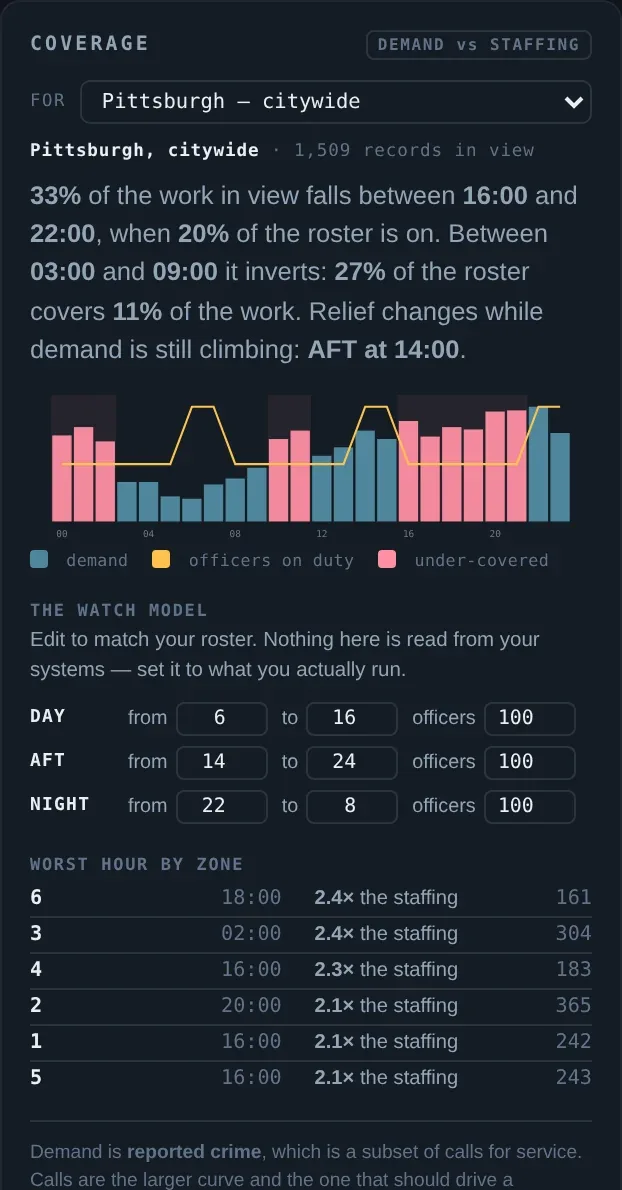
Demand against staffing, hour by hour, per zone, per sector. The finding that reorganized a bureau in one sentence is now a screen that recomputes every month instead of once every two years.
Every course of action is a pre-registered prediction — the expected effect written down before deployment — so the result is a measurement, not a story told afterwards.
The whole product is organized around the questions a watch commander actually asks, in the order they ask them.
Every record as a dot, or as density. Filter by window, zone, sector and category. Zones and patrol sectors as boundary layers. Click anything to see the records behind it.
Where crime changed against its own baseline. Where it never stops. What was cleared by arrest. What a game, a bar strip or a casino does to the blocks around it — with the statistics to say so.
Demand against your roster, by hour. Two or three costed courses of action that differ in officer-hours and in how soon you could prove they worked. A printable watch order.
Every 150-meter cell is scored against its own previous 84 days, seasonally corrected. A permanently busy corner does not light up; a quiet one that just turned does. Click any place and it explains itself in plain language: which offenses, what hours, how tightly grouped, when the run started.
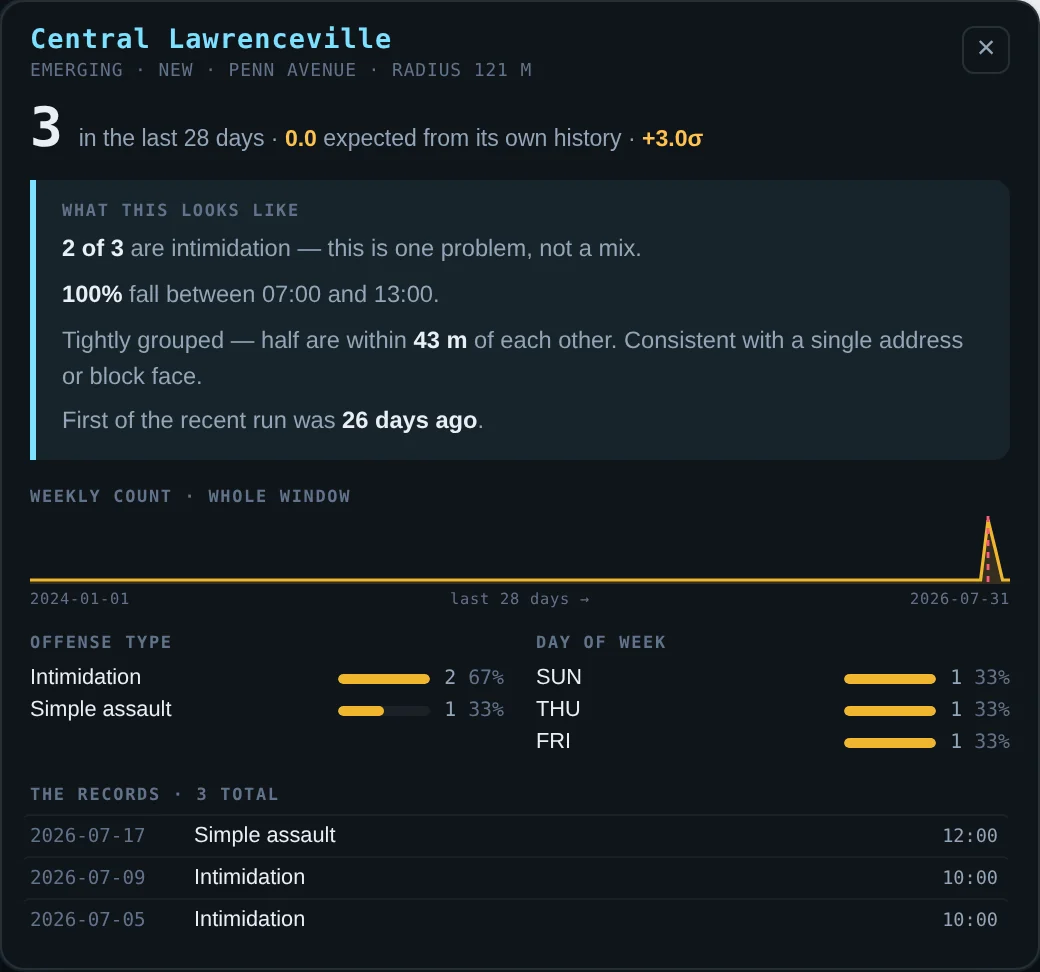
Day of week by hour of day, for whatever is on screen. Click a square and it tells you how many of that weekday actually carried incidents.
Thirteen of thirteen Mondays is a standing problem worth a standing response. Thirty-four records on one night is an event that is already over — and posting a car there next Monday is wasted. Nothing else on your desk makes that distinction for you.

Incident demand across 24 hours against your roster, per zone or per sector. Edit the watch model to match what you actually run — nothing is read from your systems — and the finding recomputes on the spot.
Built from what changed, scoped to one zone, targeting the sectors that need it. Each option states places, the surge window, the patrol dose, officer-hours per week, and which hours you would thin to pay for it.
Then the part nobody else ships: whether the result will be measurable. Crime counts are Poisson, and a single hot spot at real-world volume cannot be graded in a month. Pool eleven places and you can — in about sixteen weeks. The tool says which, before you commit.
| OPTION | COST | PLACES | MEASURABLE IN |
|---|---|---|---|
| HOLD | 5.4 hrs/wk | 3 | ~1 year |
| CONCENTRATE | 9.0 hrs/wk | 5 | ~40 weeks |
| SATURATE | 26.4 hrs/wk | 11 | ~16 weeks |
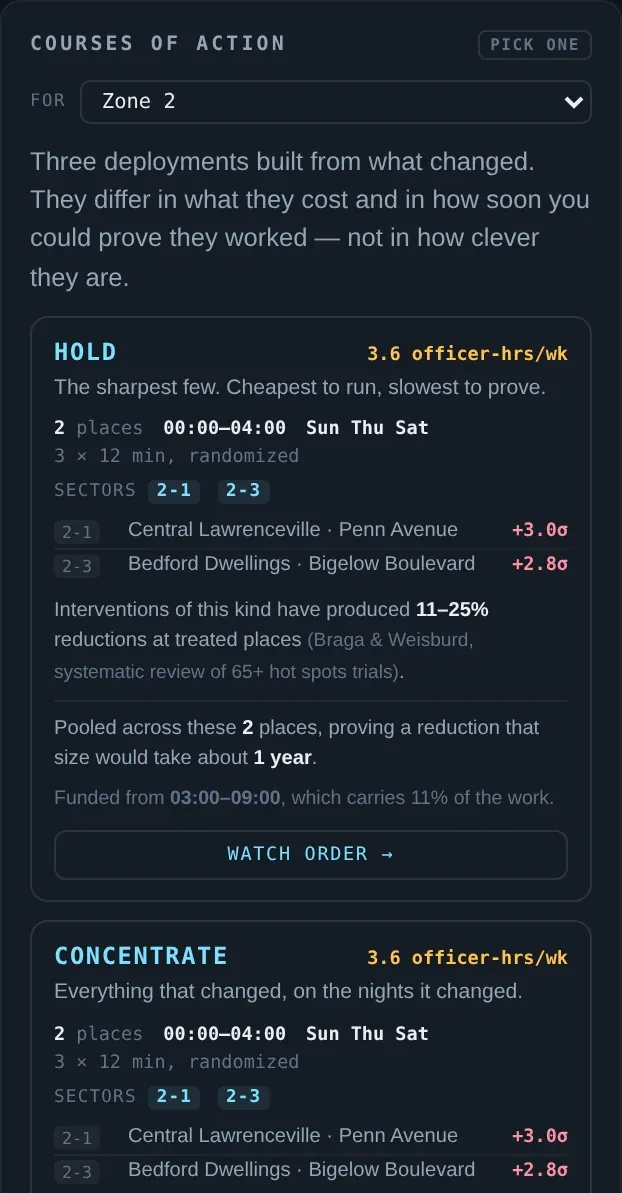
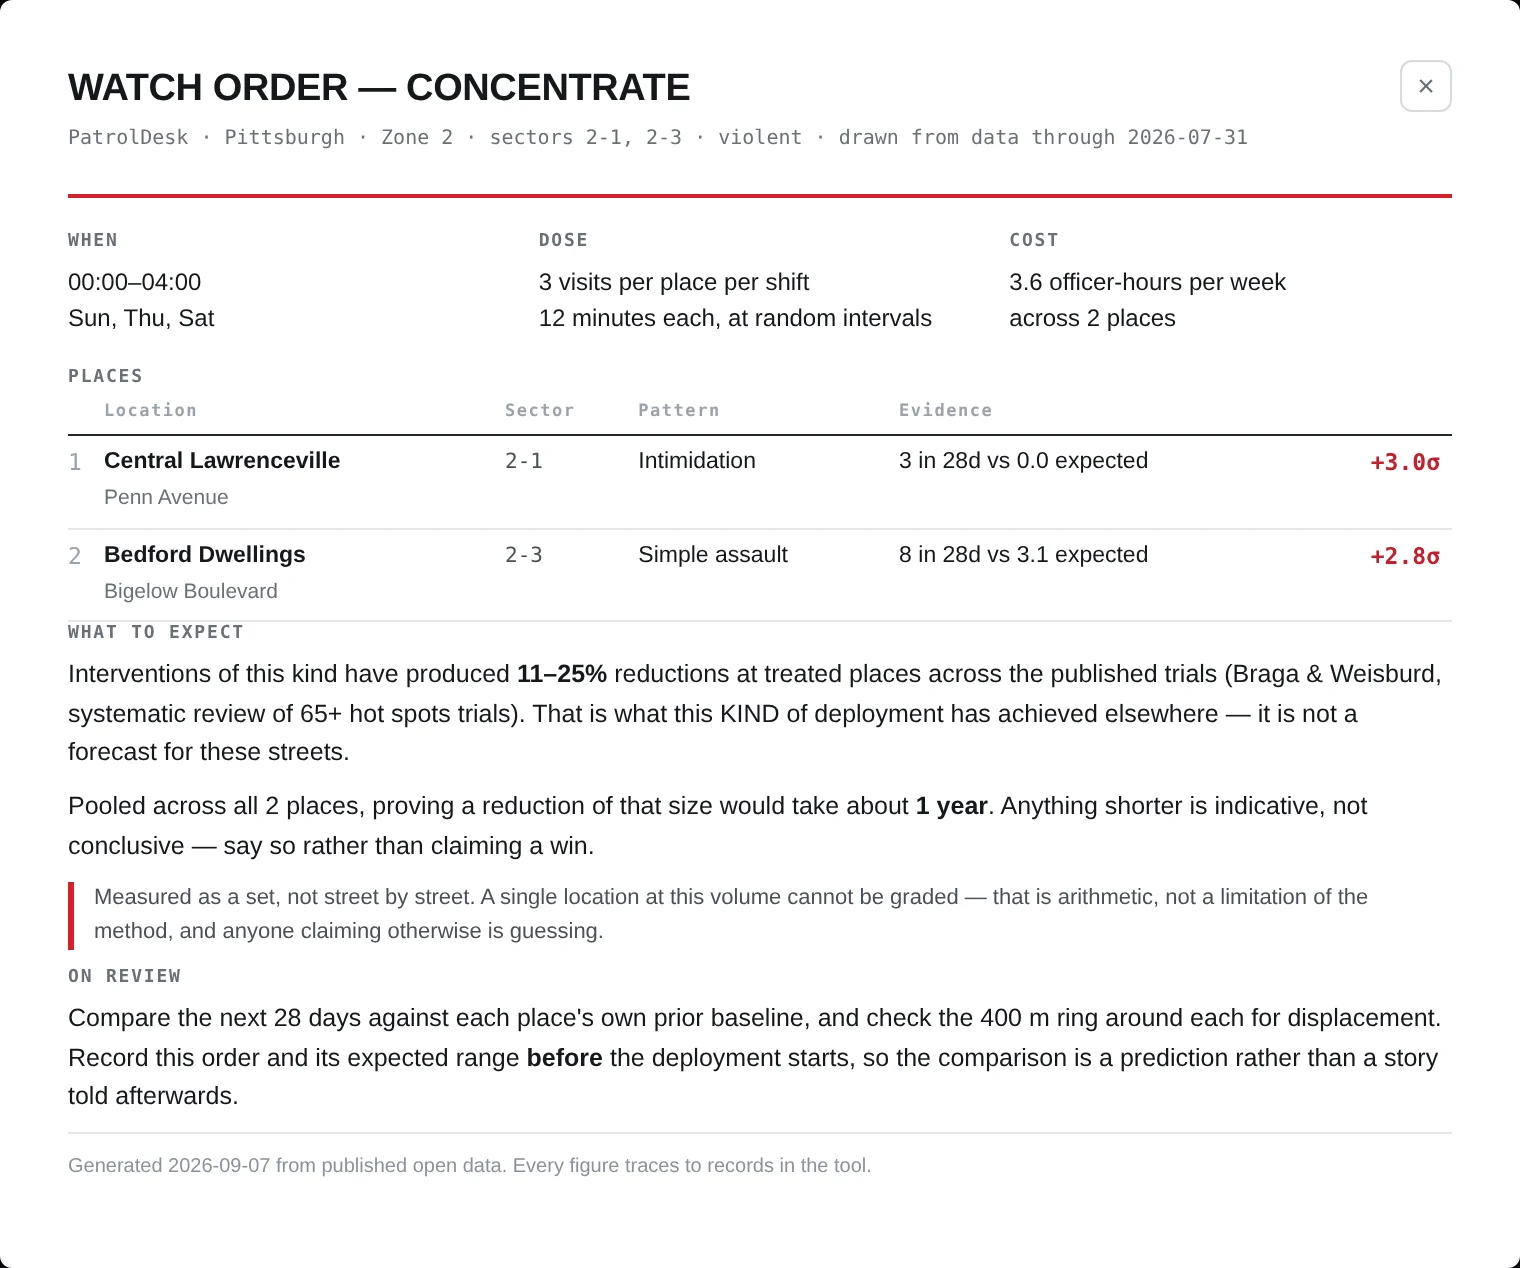
When, dose, cost, the numbered places with their sector and their evidence, what to expect — and the grading terms, written down before the deployment starts. That is what turns a result into a prediction rather than a claim.
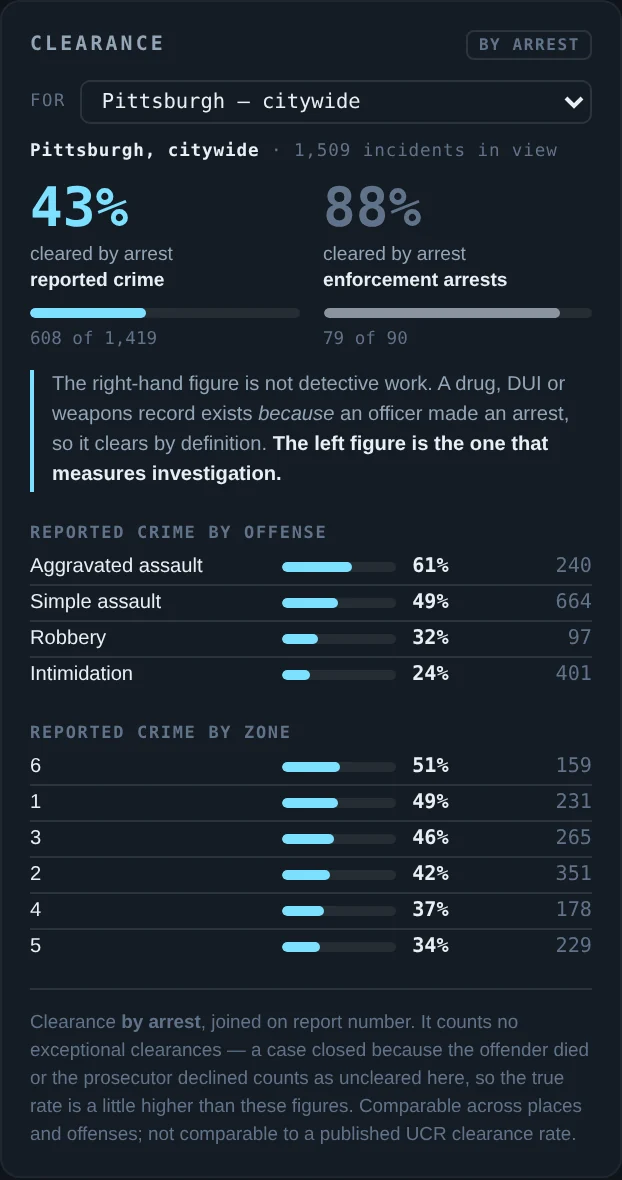
Incidents and arrests link by report number, so PatrolDesk computes clearance by arrest per place, per offense, per zone. It always splits reported crime from enforcement arrests — a drug or DUI record exists because an officer made an arrest, so blending them flatters the number and hides the part that measures investigation.
| OFFENSE | CLEARED BY ARREST |
|---|---|
| Aggravated assault | 61% |
| Robbery | 32% |
| Burglary | 14% |
| Theft from a vehicle | 2% |
Ninety-eight percent of car break-ins never end in an arrest. That is not a patrol problem — and knowing which lever applies is the whole point.
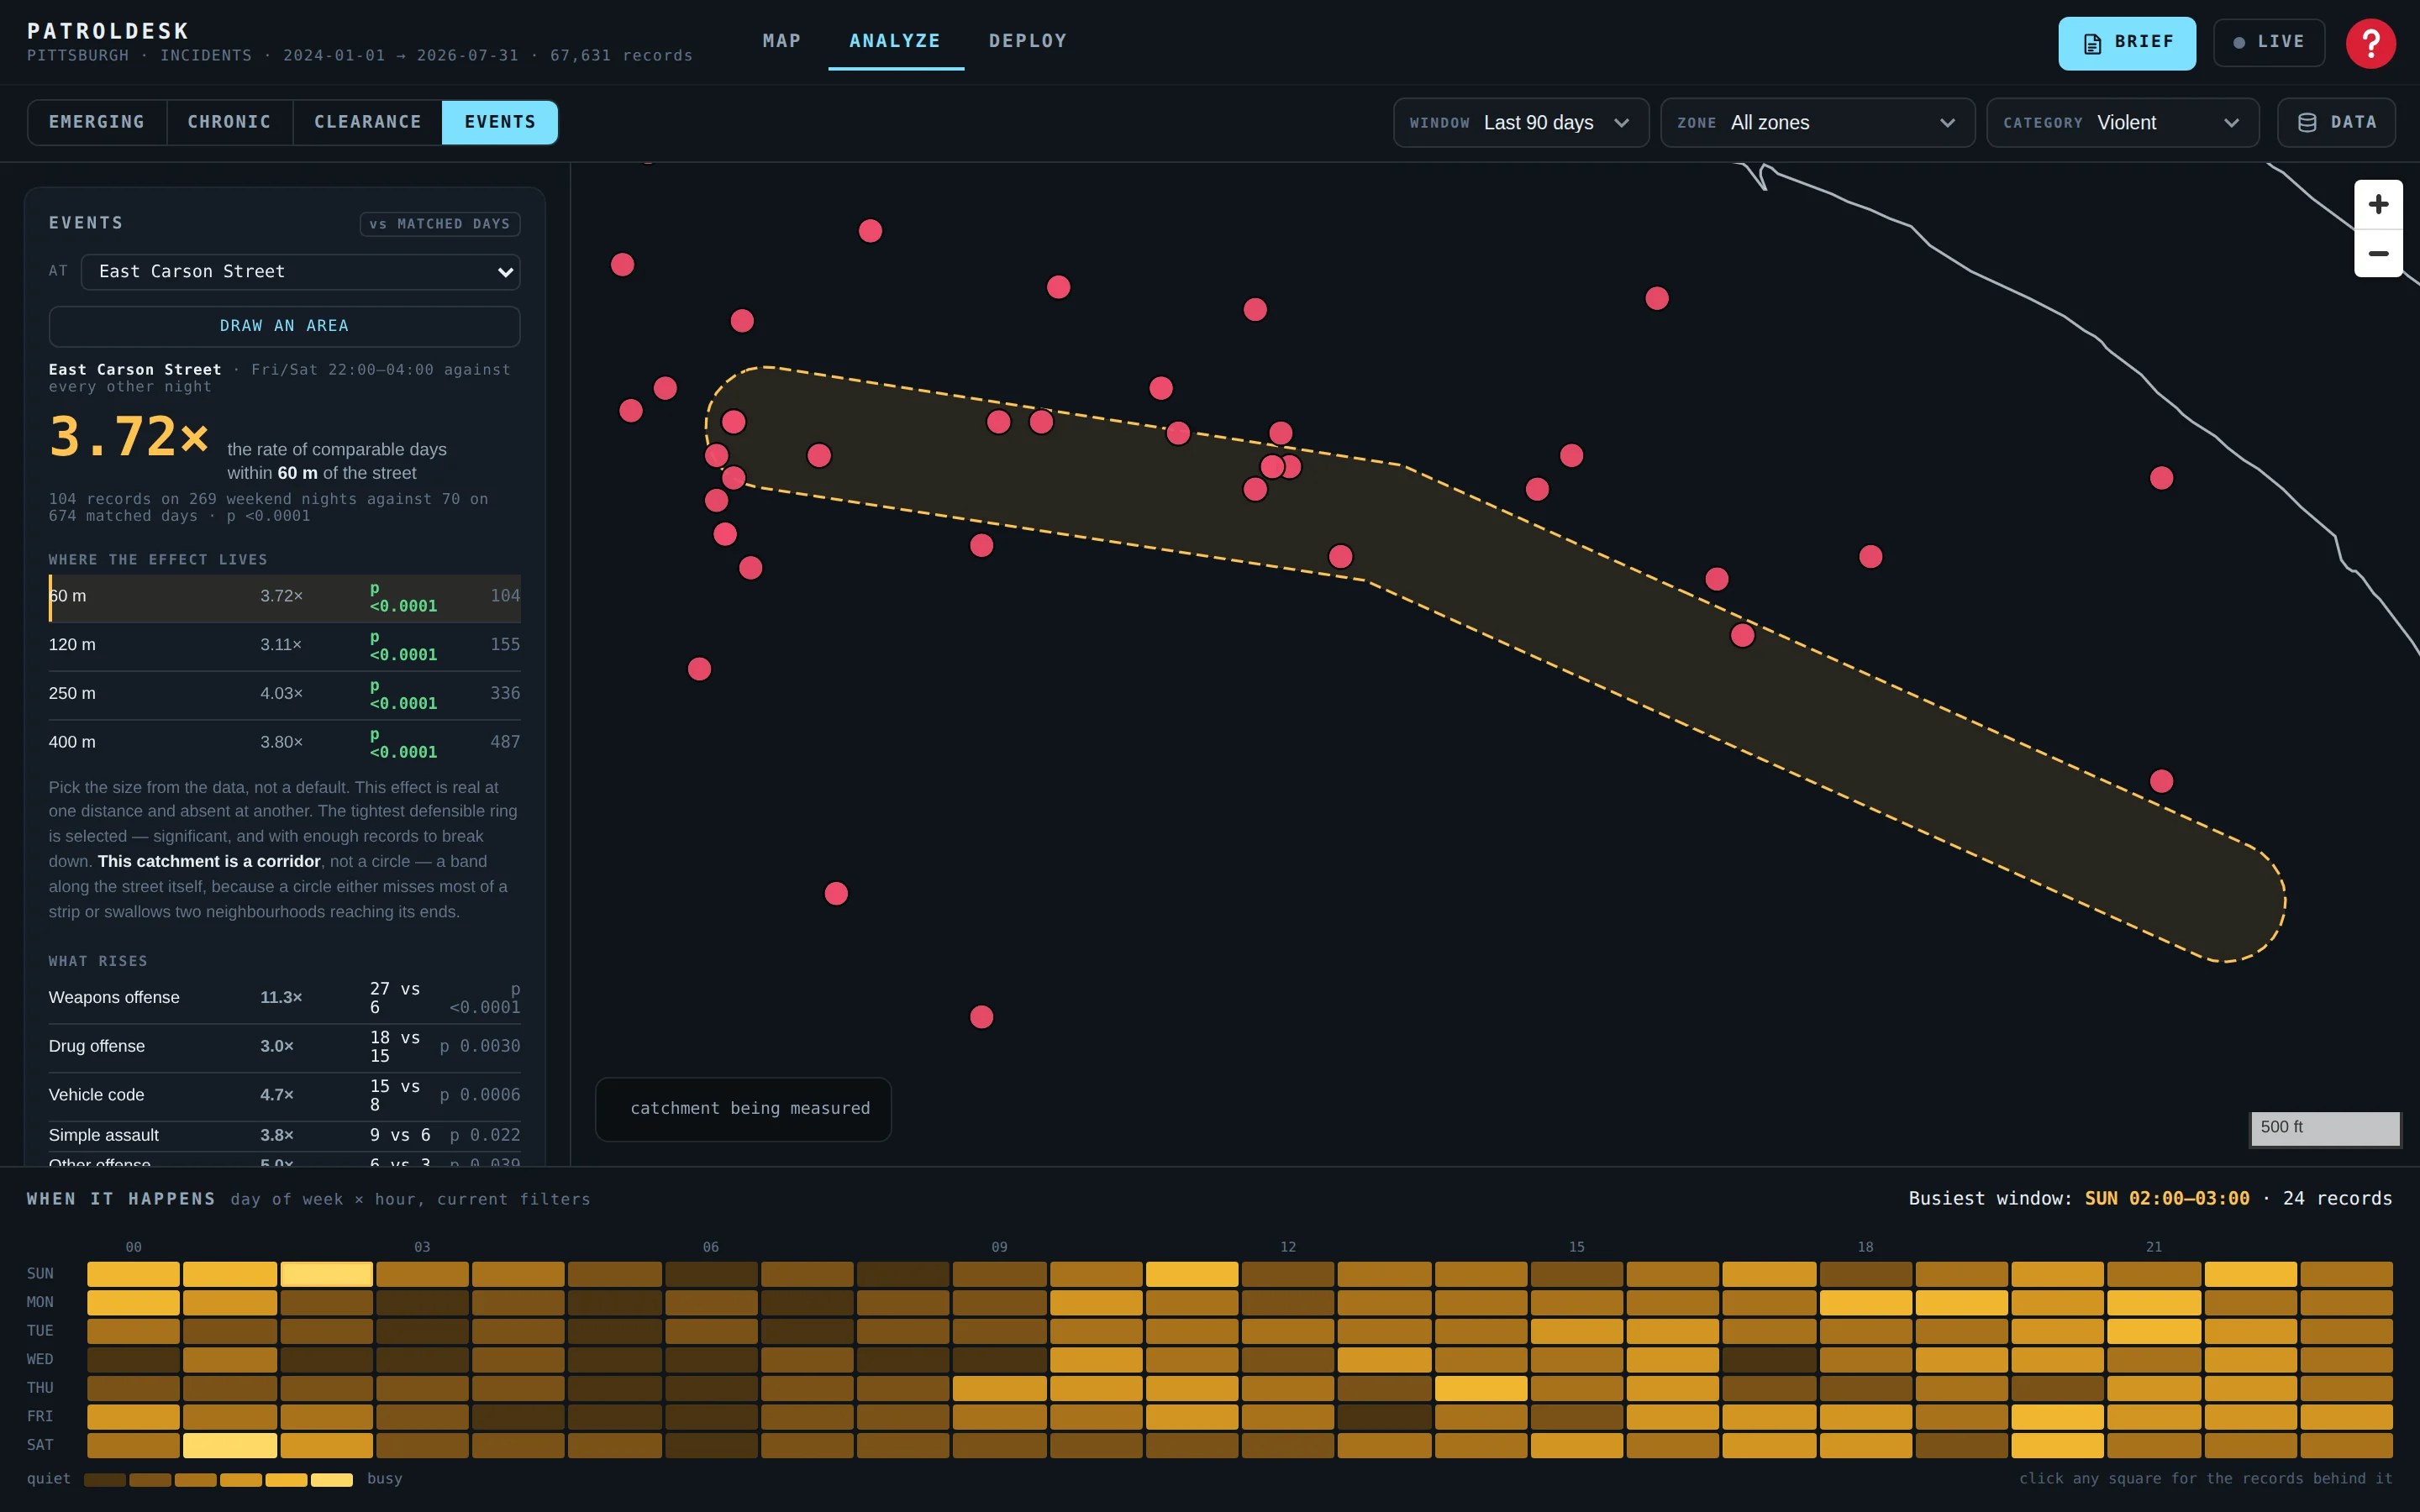
Home dates matched against non-event days of the same weekday and month. The radius is a finding, not a setting: PatrolDesk sweeps it and reports where the effect actually lives. Venues that are streets get a corridor, not a circle — or draw any shape you want on the map.
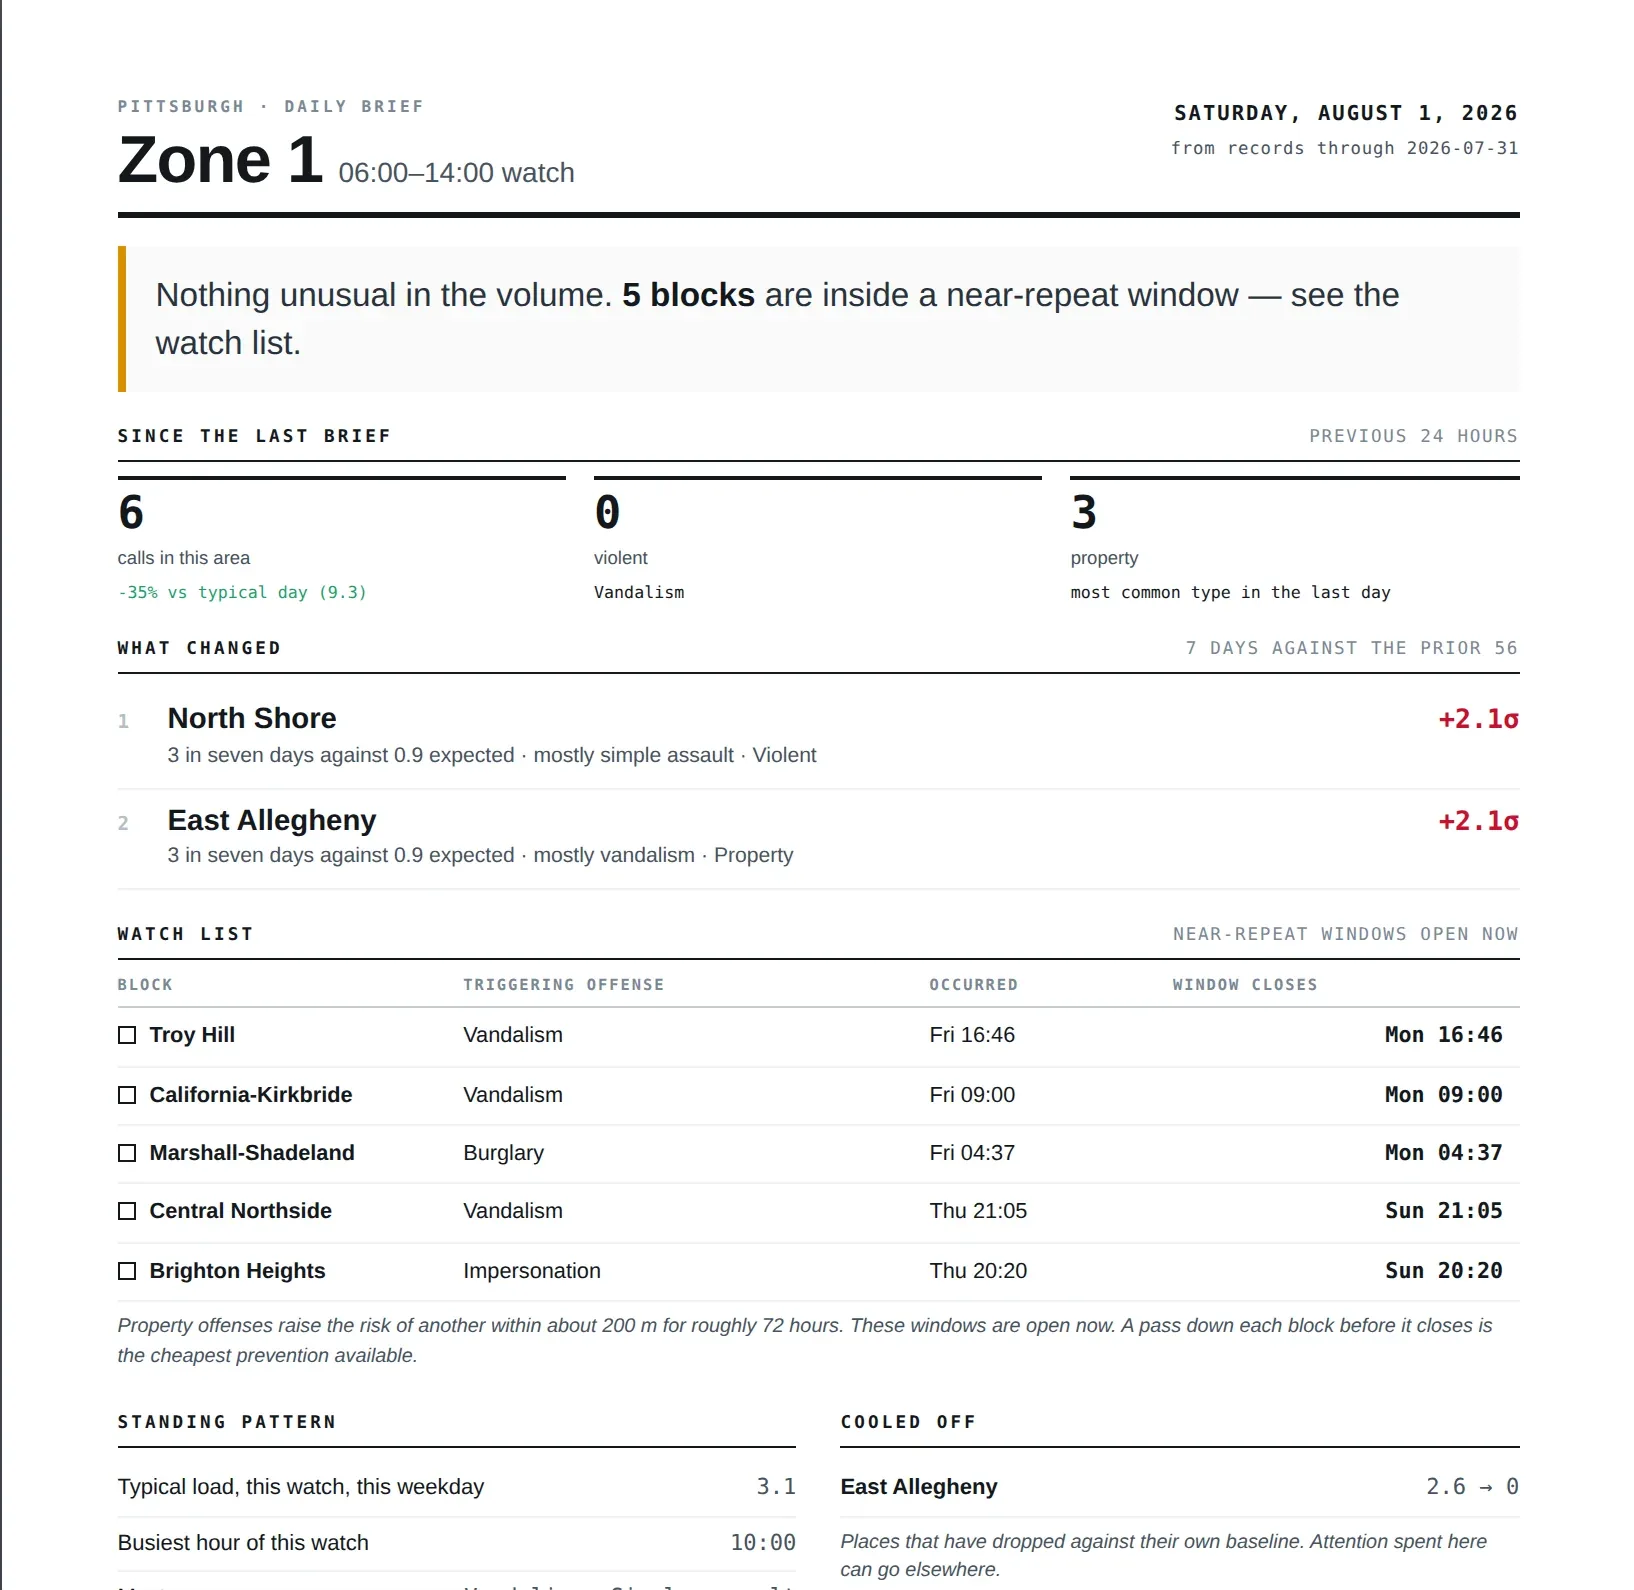
One page per zone per watch — or all three watches on a page — that a commander can read aloud in two minutes. What changed, what is still open, what the typical load looks like tonight. Paged like a document, printed like one. No text is generated by a language model. Every sentence is computed from records, which is what makes it safe to act on and auditable afterwards.
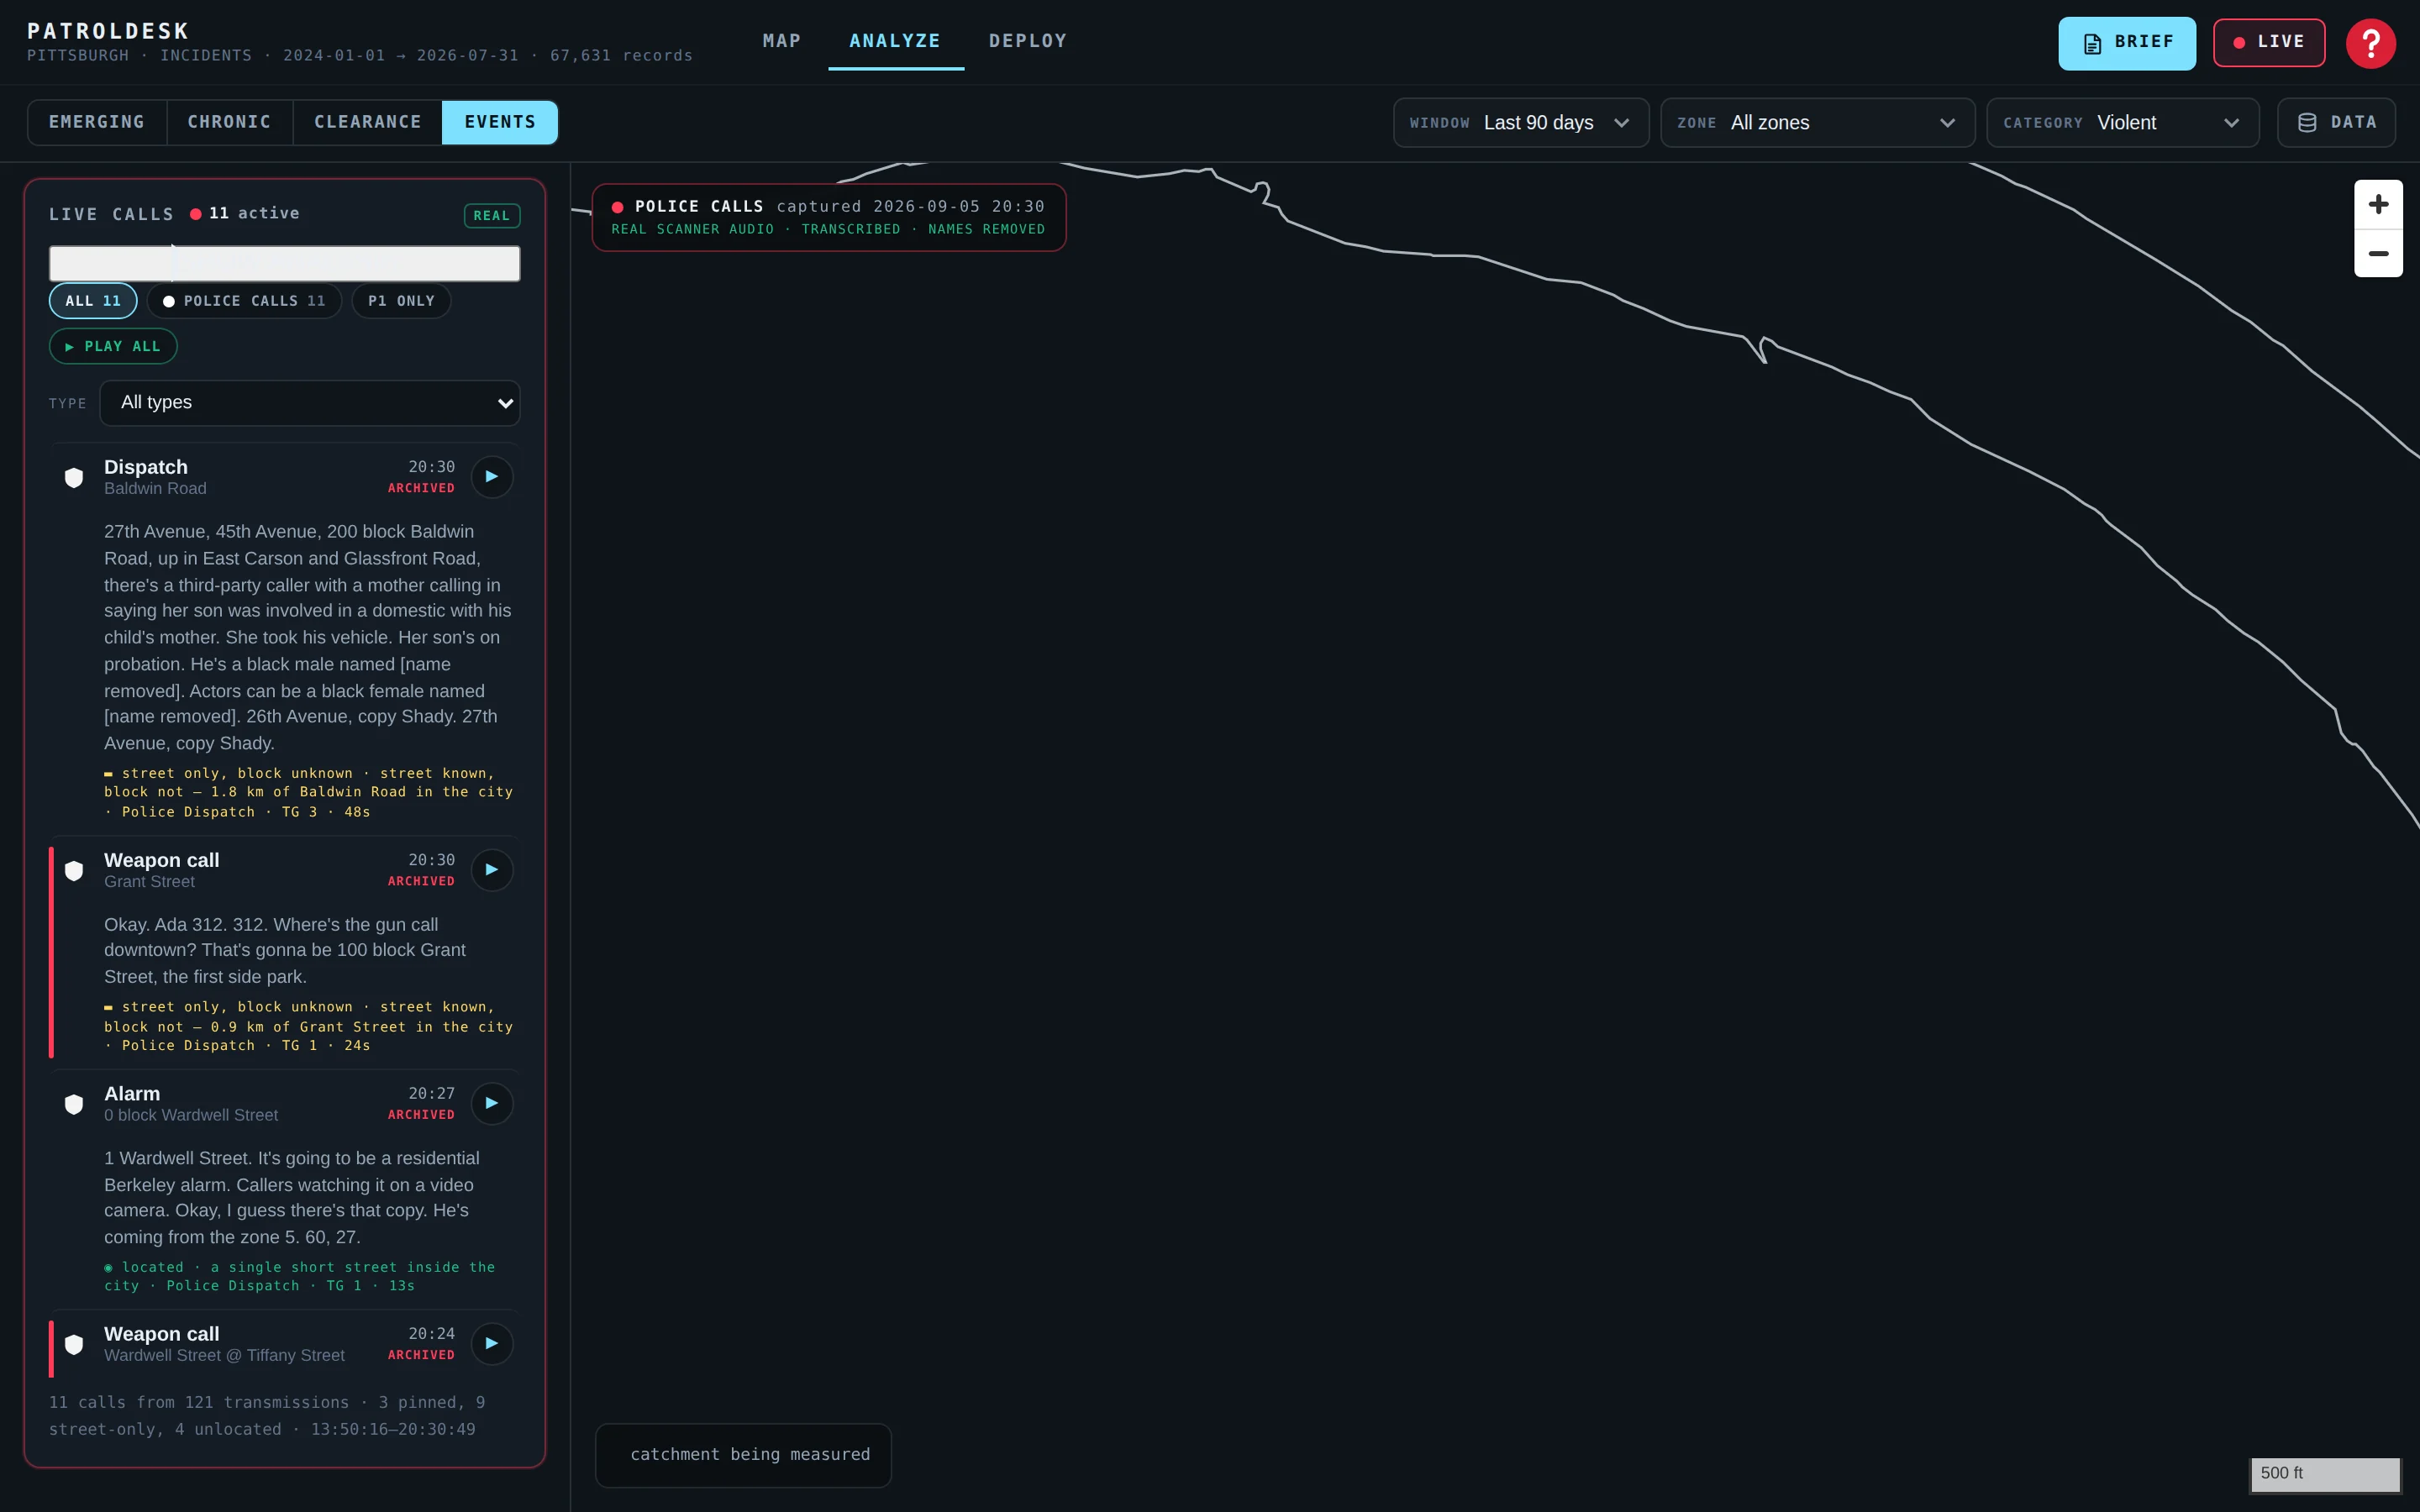
Where a department’s radio is public, PatrolDesk transcribes it and plots the calls — with the log on the left and the map following the selected call. Medical and mental-health calls dropped entirely. Names stripped. Addresses rounded to the block, in the transcript as well as on the pin. No pin unless an intersection resolves it.
With a read-only CAD feed, the same screen goes from minutes behind to live, with exact addresses. That conversation is a configuration, not a rebuild.
This category has burned its buyers. PatrolDesk is built on the opposite premise: a tool that admits a null result is a tool whose positive results can be believed.
After a property crime, the odds of another within 200 m in 72 hours run about 1.19× in Pittsburgh. Real, modest — and labeled no strong signal rather than dressed up.
A course of action quotes what interventions of that kind have produced across 65+ published trials, attributed — never a forecast for a particular street.
At a single hot spot, a 16% reduction is invisible for months. PatrolDesk computes that up front and says whether you will be able to tell.
Clusters, matrix cells, brief findings — click any of them and the records are listed. When crime statistics are argued about in public, that is not a technical nicety. It is cover.
Most agencies under 100 sworn have no crime analyst and no budget for one. PatrolDesk does the analyst’s first week of work in the time it takes to load — on the data you already publish, with no integration and no IT project.
Records systems count. PatrolDesk decides — where to surge, on which nights, at what cost in officer-hours, and how long until you can prove it worked. It runs per zone and per sector, so a watch commander sees only the ground they own.
Eight cities run today on their open-data portals — Socrata, ArcGIS, CKAN — with no access to any internal system. That is deliberate: staying on public data is what lets a department start in a day, and what keeps the product outside the CJIS wall until you choose to connect a feed.
Every dataset passes a validation framework before it reaches a screen. Each rule exists because a real feed failed it.
TIMEZONE_TROUGHQuiet hours must fall 03:00–07:00 local. Caught a feed shipped four hours off.DUPLICATE_GRAINDetects one-row-per-charge feeds — a single arrest published as 30 records — and tells masking from duplication.ZONE_AGREEMENTEvery record checked against its boundary polygon. Found a missing downtown sector at 36% miss rate.CATEGORY_DOMINANCEFlags a single offense code above 15% — traffic and parking dominating a “crime” hot spot.+ 9 moreCoordinate containment, temporal gaps, volume steps, geocode rate, date sanity, vocabulary match, precision, time-of-day, boundary coverage.Annual, per department, unlimited seats. No hardware, no per-officer licensing, no data fees.
First year is often grant-eligible: sub-$25,000 is the band a single Byrne JAG sub-award has covered for police software elsewhere. Pilot agreements available — one zone, ninety days, and if the emerging list tells your commanders nothing they didn’t already know, you’ve lost nothing.
PatrolDesk is deployment-intelligence software for police departments. It reads the incident data a department already publishes and answers three questions: where crime is changing, whether officers are on duty when and where the work is, and which course of action can be proven to have worked.
The incident records a department already publishes to its open-data portal (Socrata, ArcGIS, CKAN or a CSV export), plus public feeds like the National Weather Service. Every dataset passes a 13-rule validation before it reaches a screen. A read-only CAD or RMS feed can be added later for live, exact-address data.
No. It starts on published data with no integration and no IT project, usually the same day. Connecting a CAD or RMS feed is optional and is a configuration, not a rebuild.
No. PatrolDesk forecasts places and hours, never people. It never prints a probability of success; each course of action quotes the published research on what interventions of that kind have produced, and states up front whether the result will be measurable.
Annual, per department, unlimited seats, no hardware and no per-officer licensing. Small departments under 100 sworn: $6,000–12,000 a year. Mid-size: $18,000–30,000. Large: $30,000–60,000. CAD-connected enterprise deployments are quoted. Ninety-day single-zone pilots are available.
Both the 40-officer department with no crime analyst and the 900-officer department whose CAD analytics only say what happened. It runs per zone and per sector, so a watch commander sees only the ground they own.
A dashboard shows counts. PatrolDesk scores each place against its own history, computes staffing against demand by hour, prices two or three deployments in officer-hours, and writes the expected effect down before the deployment so the result is a measurement rather than a story.
Send your department's name through the contact form. If your incident data is published, we can show PatrolDesk running on it before the first call ends.
If your department publishes incident data, we can show you PatrolDesk running on it before the first call ends.
 PATROLDESK